python實(shí)現(xiàn)線性回歸算法
本文用python實(shí)現(xiàn)線性回歸算法,供大家參考,具體內(nèi)容如下
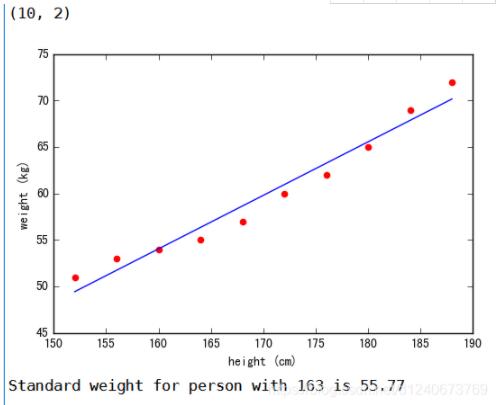
# -*- coding: utf-8 -*-'''Created on Fri Oct 11 19:25:11 2019'''from sklearn import datasets, linear_model # 引用 sklearn庫(kù),主要為了使用其中的線性回歸模塊# 創(chuàng)建數(shù)據(jù)集,把數(shù)據(jù)寫入到numpy數(shù)組import numpy as np # 引用numpy庫(kù),主要用來(lái)做科學(xué)計(jì)算import matplotlib.pyplot as plt # 引用matplotlib庫(kù),主要用來(lái)畫圖data = np.array([[152,51],[156,53],[160,54],[164,55], [168,57],[172,60],[176,62],[180,65], [184,69],[188,72]])# 打印出數(shù)組的大小print(data.shape)# TODO 1. 實(shí)例化一個(gè)線性回歸的模型model=linear_model.LinearRegression()# TODO 2. 在x,y上訓(xùn)練一個(gè)線性回歸模型。 如果訓(xùn)練順利,則regr會(huì)存儲(chǔ)訓(xùn)練完成之后的結(jié)果模型x,y=data[:,0].reshape(-1,1),data[:,1]regr=model.fit(x,y)# TODO 3. 畫出身高與體重之間的關(guān)系plt.scatter(x,y,color='red')# 畫出已訓(xùn)練好的線條plt.plot(x, regr.predict(x), color=’blue’)# 畫x,y軸的標(biāo)題plt.xlabel(’height (cm)’)plt.ylabel(’weight (kg)’)plt.show() # 展示# 利用已經(jīng)訓(xùn)練好的模型去預(yù)測(cè)身高為163的人的體重print ('Standard weight for person with 163 is %.2f'% regr.predict([[163]]))
以上就是本文的全部?jī)?nèi)容,希望對(duì)大家的學(xué)習(xí)有所幫助,也希望大家多多支持好吧啦網(wǎng)。
相關(guān)文章:
1. IntelliJ IDEA安裝插件的方法步驟2. Docker 部署 Prometheus的安裝詳細(xì)教程3. idea重置默認(rèn)配置的方法步驟4. idea導(dǎo)入maven項(xiàng)目的方法5. IntelliJ IDEA設(shè)置自動(dòng)提示功能快捷鍵的方法6. idea設(shè)置代碼格式化的方法步驟7. IntelliJ IDEA調(diào)整字體大小的方法8. 通過(guò)Django Admin+HttpRunner1.5.6實(shí)現(xiàn)簡(jiǎn)易接口測(cè)試平臺(tái)9. idea打開(kāi)多個(gè)窗口的操作方法10. idea給項(xiàng)目打war包的方法步驟

 網(wǎng)公網(wǎng)安備